Denver Leads the Nation in the Increase in the Number of Unsold Listings (aka "Inventory")
Denver has double the active listings it had before the pandemic, and the most going back at least 10 years. Why? Because

The map from realtor.com displayed below shows the wide disparity in the increase of active listings compared to before the pandemic. The darker the red, the greater the increase over pre-pandemic levels, and Denver is the darkest at a 100% increase, or double the number of pre-pandemic listings. Coming in second was Austin with 69% increase, then Seattle with 60.9% increase.

The cities in blue have fewer active listings than they did prior to the pandemic, with Hartford down 77.7%, Chicago down 59.3%, and Virginia Beach down 56.7%.
Here’s a link to the
One never knows which “Denver” statistics the media are referring to. Is it only the City and County of Denver? Is it ZIP codes beginning with 802 (which includes Lakewood)? Is it the Denver metro area — and how do they define it? Is it the “Denver MLS,” which is REcolorado, but which carries listings far flung from Denver itself? And does it include the listings from the northern Colorado MLS, IRES, which are also displayed on REcolorado?
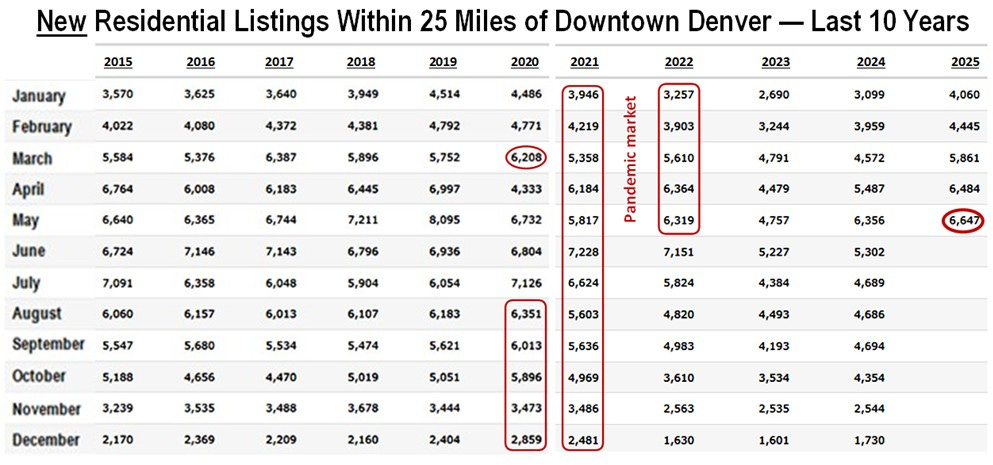
Because of that, I choose to do my own analysis on REcolorado whenever I read about Denver statistics. Below is a chart I created from REcolorado data using the criteria described in its headline. If you consider March 2020 as “pre-pandemic,” that figure is roughly half the number of active listings in May 2025, so the 100% increase holds true — although that has to be a coincidence, since I can assure you that realtor.com doesn’t use my 25-mile radius of downtown Denver as their definition of “Denver.”

There is another factor which realtor.com didn’t consider in analyzing the figures represented by the map above. The reason today’s inventory is so high in Denver is that the listings aren’t selling as readily as they do in, say, the northeast and Midwest. If we had more buyer demand here, the number of unsold listings would be much smaller. So, really, that map measures buyer demand.
Although I don’t have access to the raw data for Boston, Hartford or Chicago, I would guess that sellers are putting their homes on the market at about the same rate as here in Denver, but there are more buyers ready, willing and able to snap them up.
That was the situation during the pandemic. Media complained that sellers weren’t putting their homes on the market, but I pointed out in my columns at the time that new listings had not decreased much. Buyers were simply snapping up new listings right away. Here’s a chart proving that sellers were not keeping their listings off the market during the pandemic: